
1 Electric Power System
Definition of EPS
A system is a set of devices interconnected to fulfill previously specified function.
An energy system is defined as all components related to the production, conversion, delivery, and use of energy. The system structure, so a system itself is formally determined by a pair of ordered sets S = <U, K>, where U – a set of devices and K – a set of relations of interconnections of these devices, it is a set of configurations.
Energy systems are divided according to energy carriers on:
- electric power systems,
- thermal systems,
- gas-energy systems,
- systems of solid fuel supply
- systems of liquid fuel supply.
An electric power system is a network of electrical components deployed to supply, transfer, and use electric power.
Basic elements of electric power system (EPS) are:
- generating units (power plants),
- transmission network,
- distribution network.
Main components of EPS
A generating unit is created by a separated set of power plants’ devices, which form independent technologic series of electric energy generation and which can generate electric energy by itself. Generating units are divided into traditional: coal, nuclear, gas, liquid fuels, and, recently quickly developing units based on renewable energy sources: hydro, wind, biomass and others.
An electric power network is a set of cooperating electric power lines and substations used for transmission, transformation and distribution of electric energy on specified area. Lines are divided into overhead with bare and insulated conductors and into cables. The following elements are met in substations: transformers, reactors (choking coils), capacitors, bus bars, switches and others.
Characteristic features of EPS
The characteristic feature of EPS is that it covers large territory because usually it is the whole country.
Long distances in case of large countries like Russia, Canada, USA, Australia, Brazil force to intensive research investigations in the area of electrical energy transmission technology on long distances (especially high voltage direct current transmission lines – HVDC).
With current initiatives on smart grid and sustainable energy, distributed generations (DGs) and renewable energy sources (RES), characterized by relatively small powers are going to play vital role in the emerging small, independent, local electrical power systems.
From cybernetics point of view EPS is a huge system constituting multi-input and multi-output arrangement, relatively separated, dissipative, weakly self-adjustable and additionally controlled by the staff.
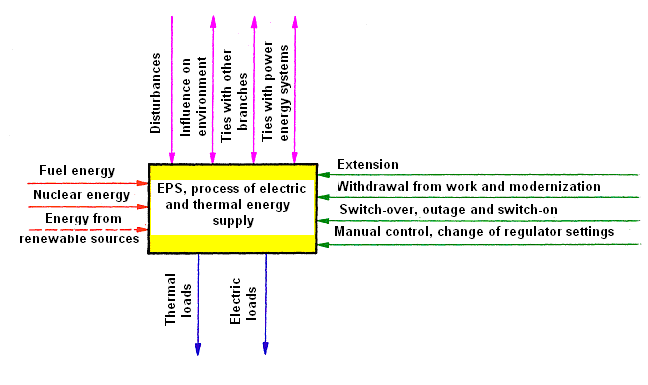
The extension/development of EPS is directly connected with other branches of economy for which EPS serves and on which its development and existence depends. These are industry of fuel mining and reprocessing, other electric power systems, hydro economy of the country, machine-building industry and scientific background, infrastructure of the country, environment, etc.
The system is characterized by many parameters. The most important of them are the following:
- peak power demanded by customers,
- annual production of electric energy,
- power installed in generating units,
- power of the largest generating unit,
- the highest nominal voltage of the transmission network,
- the longest distances of power flow,
- power structure,
- network structure.
Definitions of important parameters:
Installed power of domestic power plants, it is the sum of nominal powers of all generating units (eg Poland at the end of 2002 was 34715MW).
Maximum output capacity of commercial power plants in the system, it is the sum of the continuous powers of all generating units in the system, produced by thermal generators in the continuous way in the time of at least 15 hours, and by water generators in the time of at least 5 hours, at nominal conditions of work acknowledged by tests. (eg Poland it was 31887 MW in 2004)
Available capacity of the domestic power plants it is maximum output capacity reduced by planned outages (maintenance), periodical losses, exploitation losses and others (eg in Poland in 2004 it was 26865 MW).
Maximum annual demand for power it is power measured on the lines leading the current out from power stations (eg in Poland in 2004 it was on December 23 at 17.00 and it was 23108 MW) .
Electric power system, as distinct from other economy systems, realizes tasks connected with the production, transmission and distribution of the product with immediate supply on any request of the client. It is characterized by the lack of possibility to store the product. All the production is consumed immediately. Thus the customers have the influence on production scale. It definitely determines current control of EPS operation.
Energy storage
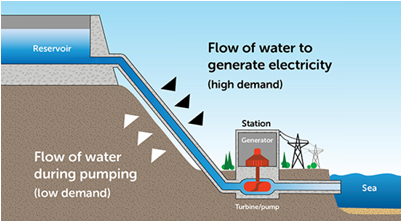
Electric energy cannot be directly stored, but some other energy carriers may be used to do it. The only one, commonly used way of electrical energy storage, is a pumped power station, in which during hours of small load the water is pumped from the lower reservoir to the upper one.
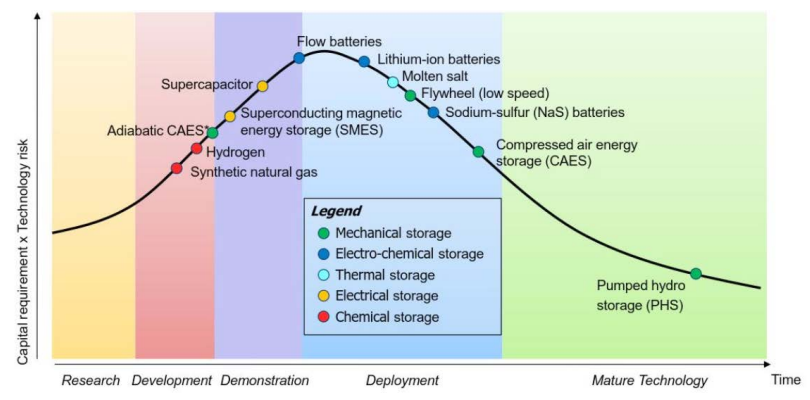
Last decade is a period of intense development of various types of energy storage other than pumped-storage hydroelectricity. Leading technologies are:
Thermal power stations:
- Molten salt
Electrochemical:
- Lithium batteries,
- Sodium-sulfur batteries (NaS),
- Lead-acid batteries,
- Nickel batteries.
Electromechanical:
- Flywheels,
- Compressed-Air Energy Storage,
Chemical:
- Hydrogen storage.
Load profile
Power structure is characterized by the way of covering system loads so it contains data about generating units. The curve of total system load by the powers demanded during 24 hours P(t) has the influence on the power structure.
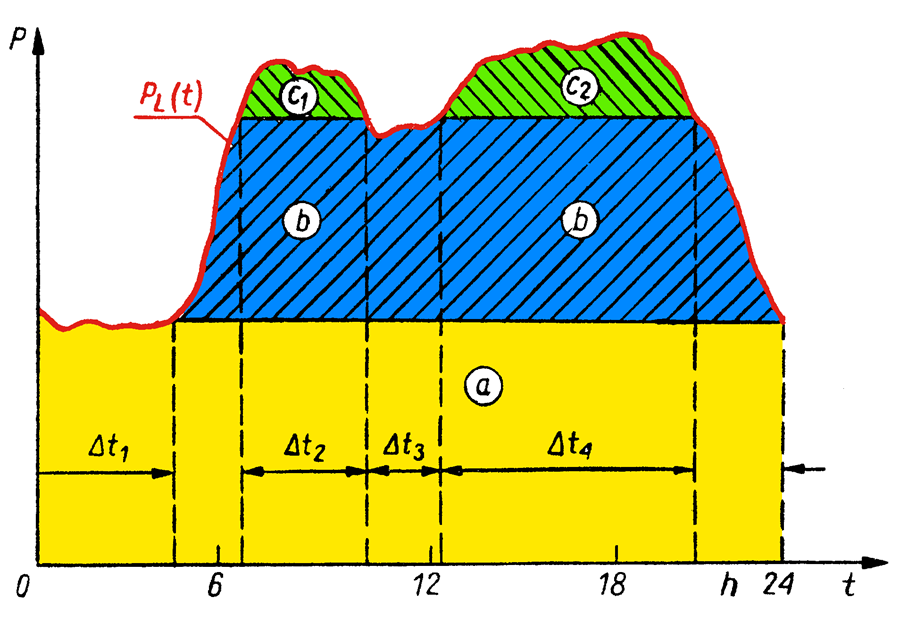
Basic load is covered by steam power plants characterized by small per-unit fuel costs, nuclear power plants and thermal-electric power stations. Midload power is covered by older thermal power stations and renewable sources.
Covering of peak load should be guaranteed by hydro generating units, gas units and liquid fuel units.
System structure
EPS can be divided on three hierarchical levels:
- generation level,
- transmission level,
- distribution level.
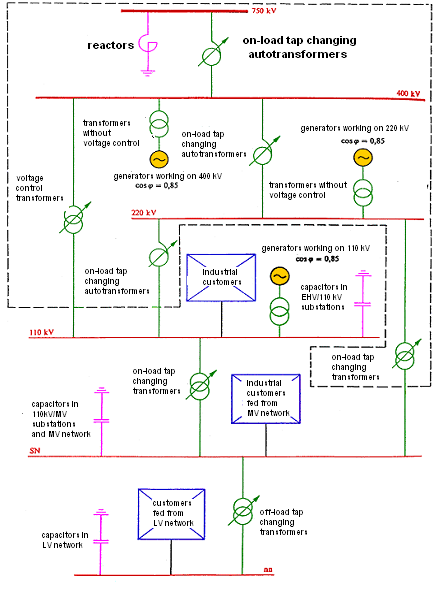
The level of generation is created by big system power stations which generators are connected to HV transmission network (400 kV, 220 kV) and to HV distribution network (110kV), through step-up transformers (the voltage on generators’ terminals is about 20 kV – to small to send the power on long distances).
The level of transmission is created by lines and electric power substations 750 kV, 400 kV and 220 kV.
The different levels of voltages are coupled by transformers (the voltage ratio > 2) or by auto-transformers (ratio ≤ 2). Reactive power compensation of opposite sign is used in HV transmission network because of its high reactive power generation. In EHV/110kV sub-stations capacitor banks for reactive power compensation are used on 110 kV side.
The level of distribution is created by networks and substations of medium and low voltages.
Capacitor banks for reactive power compensation are used in:
- substations 110kV/MV on the medium voltage side,
- MV and LV networks.
Industrial customers are supplied directly from MV network and household customers are supplied from LV network.
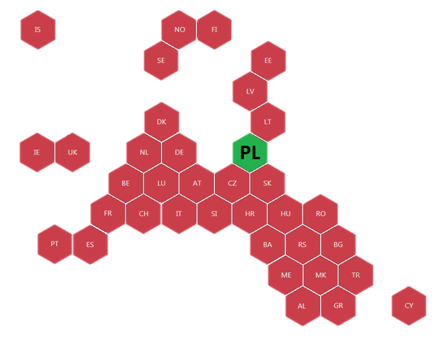
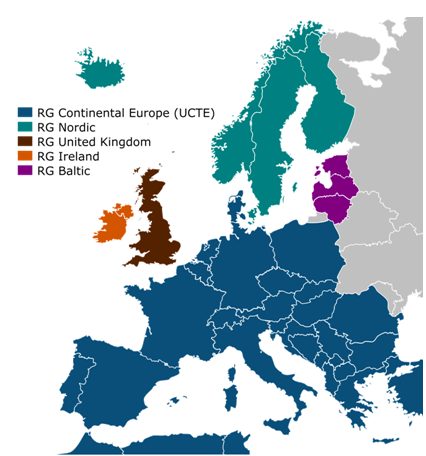
Electric power systems of different countries are often connected together and such systems are called integrated systems. These systems are organizationally independent but, in reality, they create one electric power grid. 43 TSOs from 36 countries are members of ENTSO-E (the European Network of Transmission System Operators for Electricity).
Environmental pollution
The generation, transmission and distribution of electric energy cause more and more environmental pollution.
Main but not only one cause of pollution is burning of organic fuels, which is accompanied by:
- emission of : SO2, NOx, dust, CO2, CO and heat to the atmosphere,
- thermal pollution (heating) and chemical pollution of waters,
- devastation of the area by ash dumps.
Additionally the following things are connected with electrical power engineering:
- noise pollution,
- electrical power engineering disturbances,
- stray currents in the earth,
- enlarged corrosion,
- climatic changes,
- wood cutting for electrical lines, fuel transport and others.
The main objective in managing and disposing of radioactive (or other) waste is to protect people and the environment. This means isolating or diluting the waste so that the rate or concentration of any radionuclides returned to the biosphere is harmless. To achieve this, practically all radioactive wastes are contained and managed – some clearly need deep and permanent burial. Many long-term waste management options have been investigated worldwide which seek to provide publicly acceptable, safe and environmentally sound solutions to the management of radioactive waste.
Basic parameters
The work effectiveness of electricity receivers, fed from the system, depends on parameters of energy supplied from the system.
Basic parameters of electrical energy are following:
- frequency,
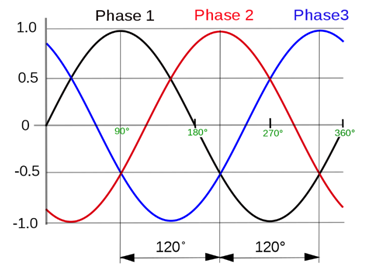
- voltage phase symmetry,
- the content of non-linear distortions in voltage curve,
- continuity of energy supply.
The most important parameter, determining the operation of EPS – frequency – depends on the active power margin in generating units and it depends on the operation of frequency automatic control systems in EPS.
Proper voltage levels are results of reactive power reserves in sources of this power and they depend on the operation of voltage automatic regulation in EPS.
The phase symmetry depends on EPS elements’ symmetry and on distribution on individual phases of single-phase receivers.
The shape of voltage curve, not being sinusoidal, results from actual continuous rise of the share of non-linear receivers in EPS. These receivers generate higher current harmonics.
The continuity of energy supply depends on the reliability of EPS elements, protection system operation and it depends on reserves in generating and transmitting devices.
Wide area synchronous grids
- standard deviation for 90% and 99% measuring intervals is lower than respectively 40 mHz and 60 mHz for the whole considered monthly period,
- number of days in a month with given frequency 49,99 or 50,01 does not exceed eight days.
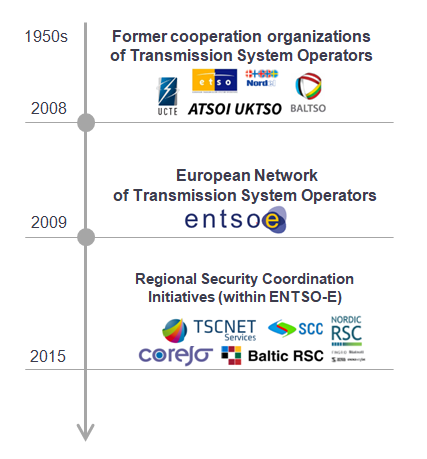
European Network of Transmission Systems
European countries are connected with one another for decades now and transmission system operators have been working in regions since the 1950s.
TSOs are responsible for security of supply in their area. In order to do this they plan decades ahead how the grid will need to evolve depending on the big trends in the power system.
From a year in advance to real time, TSOs run a continuous series of calculations and adapt their assumptions constantly to new issues arising on their grid but also that of their neighbours – notably through RSCs but also through the ENTSO-E awareness system.
- Developing European operational standards,
- Protecting critical infrastructure systems,
- Developing and maintaining a common system operation channel: the Electronic Highway,
- Developing a common model of the grid that can be used for system operation,
- Defining a methodology for dealing with operational reserves – power reserves that can be activated to maintain the grid balanced,
- Classification & follow up of operational incidents,
- Promotion and enhancement of coordinated system operation and services notably through the regional service providers.
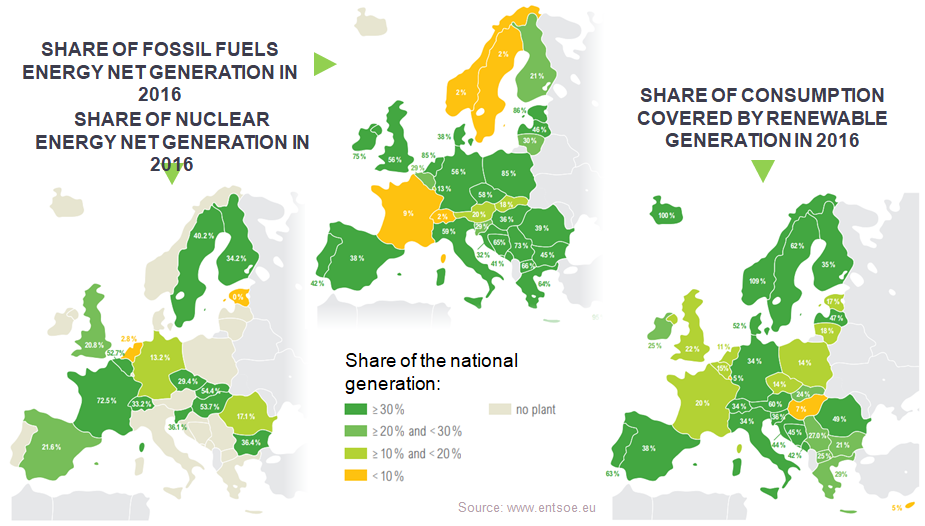
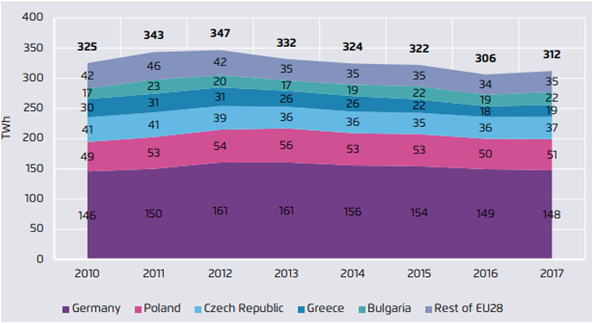
Energy net generation per country
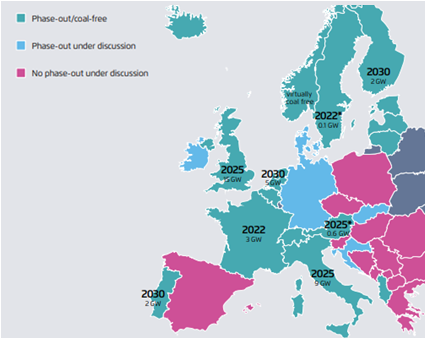
Coal electricity generation per country
Western Europe is phasing out coal, but Eastern Europe is sticking to it. Three more Member States announced coal phase-outs in 2017 – Netherlands, Italy and Portugal. They join France and the UK in committing to phase-out coal, while Eastern European countries are sticking to coal. The debate in Germany, Europe’s largest coal and lignite consumer, is ongoing and will only be decided in 2019.
New renewables generation sharply increased in 2017, with wind, solar and biomass overtaking coal for the first time. Since Europe‘s hydro potential is largely tapped, the increase in renewables comes from wind, solar and biomass generation. They rose by 12% in 2017 to 679 Terawatt hours, putting wind, solar and biomass above coal generation for the first time. This is incredible progress, considering just five years ago, coal generation was more than twice that of wind, solar and biomass.
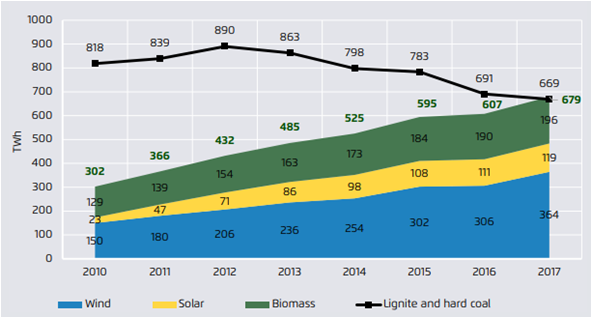
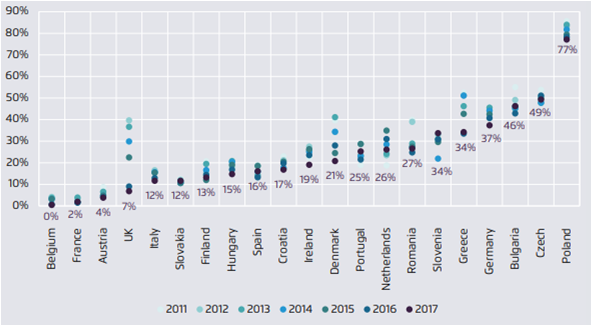
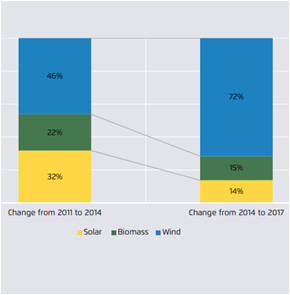
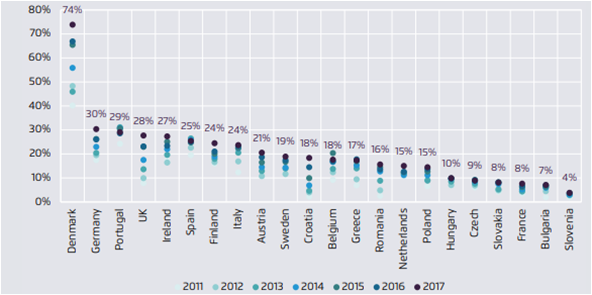
In 2017, renewables generated 30% of Europe’s electricity for the first time. Wind, solar and biomass grew to 20,9% of the EU electricity mix. This is up from just 9,7% in 2010, and represents an average growth of 1,7 percentage points per year. Wind had 46% of the EU renewables growth from 2011 to 2014, but this increased to 72% of the growth from 2014 to 2017. In the last 7 years, wind+solar+biomass increased its share of electricity production in every country, but at very different rates.
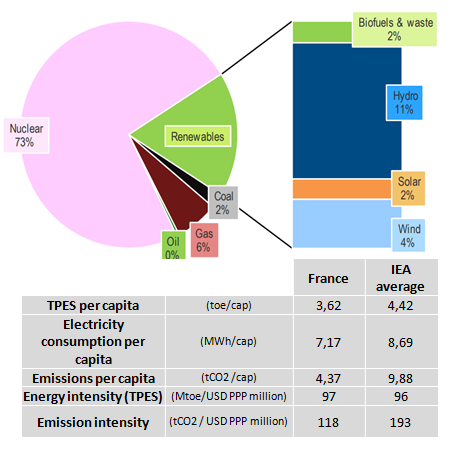
France – Energy System Overview
- Circuit Length – 105,000 km,
- Voltage Level 400-380 kV – 21%,
- Voltage Level 220-150 kV – 26%,
- Voltage Level 132-50 kV – 53%,
Connected with the systems of Belgium, Luxembourg, Switzerland, Italy, Denmark and Spain.
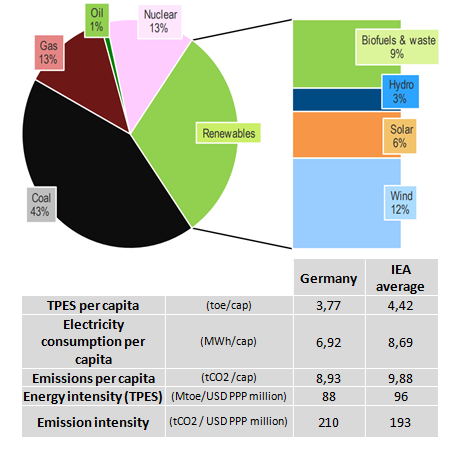
Germany – Energy System Overview
There are four transmission system operators (TSOs) in Germany. On 10 November 2017, there were 879 distribution system operators registered with the Federal Network Agency in Germany. Close to 800 of these DSOs operate networks with less than 100,000 connected costumers.
- Circuit Length – 35,000 km,
- Voltage Level 400-380 kV – 59%,
- Voltage Level 220-150 kV – 41%,
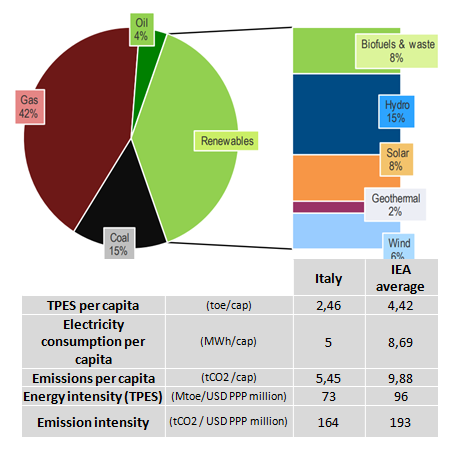
Italy – Energy System Overview
In Italy electric energy generation is based on thermal power plants (15% on coal, 42% on gas and 4% on heavy oil) and many types of renewables. Electricity Generation: 284,1 TWh 39% renewables (IEA average: 24%).
The only nuclear power plant in Italy was closed in 1987. As of 2018, Italy is one of only two countries, along with Lithuania, that completely phased out nuclear power for electricity generation after having operational reactors.
Italian transmission system:
Circuit Length – 72,600 km,
Voltage Level 400-380 kV – 19%,
Voltage Level 220-150 kV – 81%,
Connected with neighbouring systems by AC 220kV, 380kV and under-sea HVDC lines.
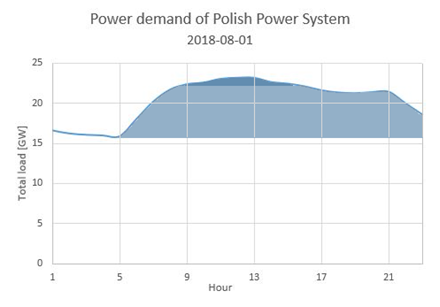
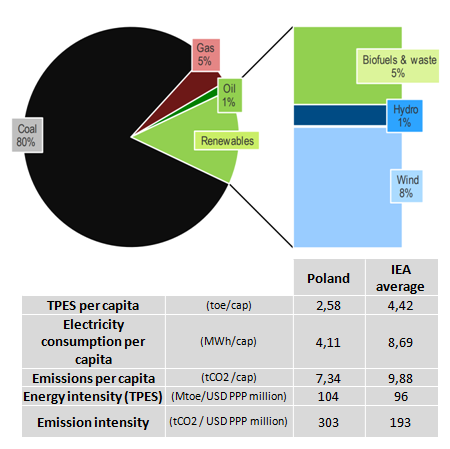
Poland – Energy System Overview
Currently (as at 31 December 2017) there are generating facilities with a net capacity totalling around 43,612 gigawatts (GW). Electricity Generation: 166,2 TWh 14% renewables (IEA average: 24%).
However, this capacity is not the same as the output available on the electricity market to meet demand at any given time, as the latter depends on the weather conditions. The supply is safeguarded almost entirely by conventional power plants.
In 2017, conventional forms of energy generated 89,89 percent of electricity in Poland.
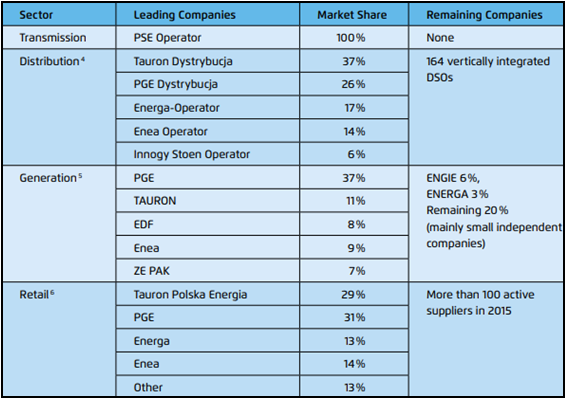
As of 2016, there were 172 DSOs operating in Poland, and among them, five large DSOs belonging to vertically integrated undertakings. As these five DSOs are parts of vertically integrated undertakings they are subject to an obligation to separate distribution activities from generation operations or other economic activities of a vertically integrated undertaking (as a result of unbundling requirements).
Tab. 1.1 Market share of Polish electricity companies. Source: Agora Energiewende, PTPiREE 2016
Polish distribution networks are typical for Europe and they have got total length:
- 110kV lines – 33 300 km
- MV lines – 296 920 km (6kV, 10kV, 15kV, 20kV, 30kV)
- LV lines – 426 416 km
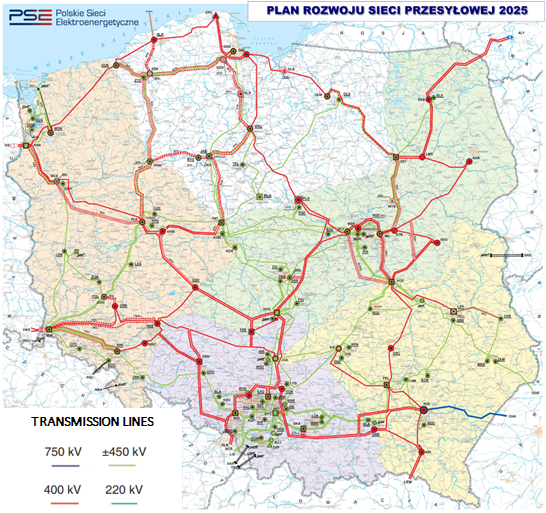
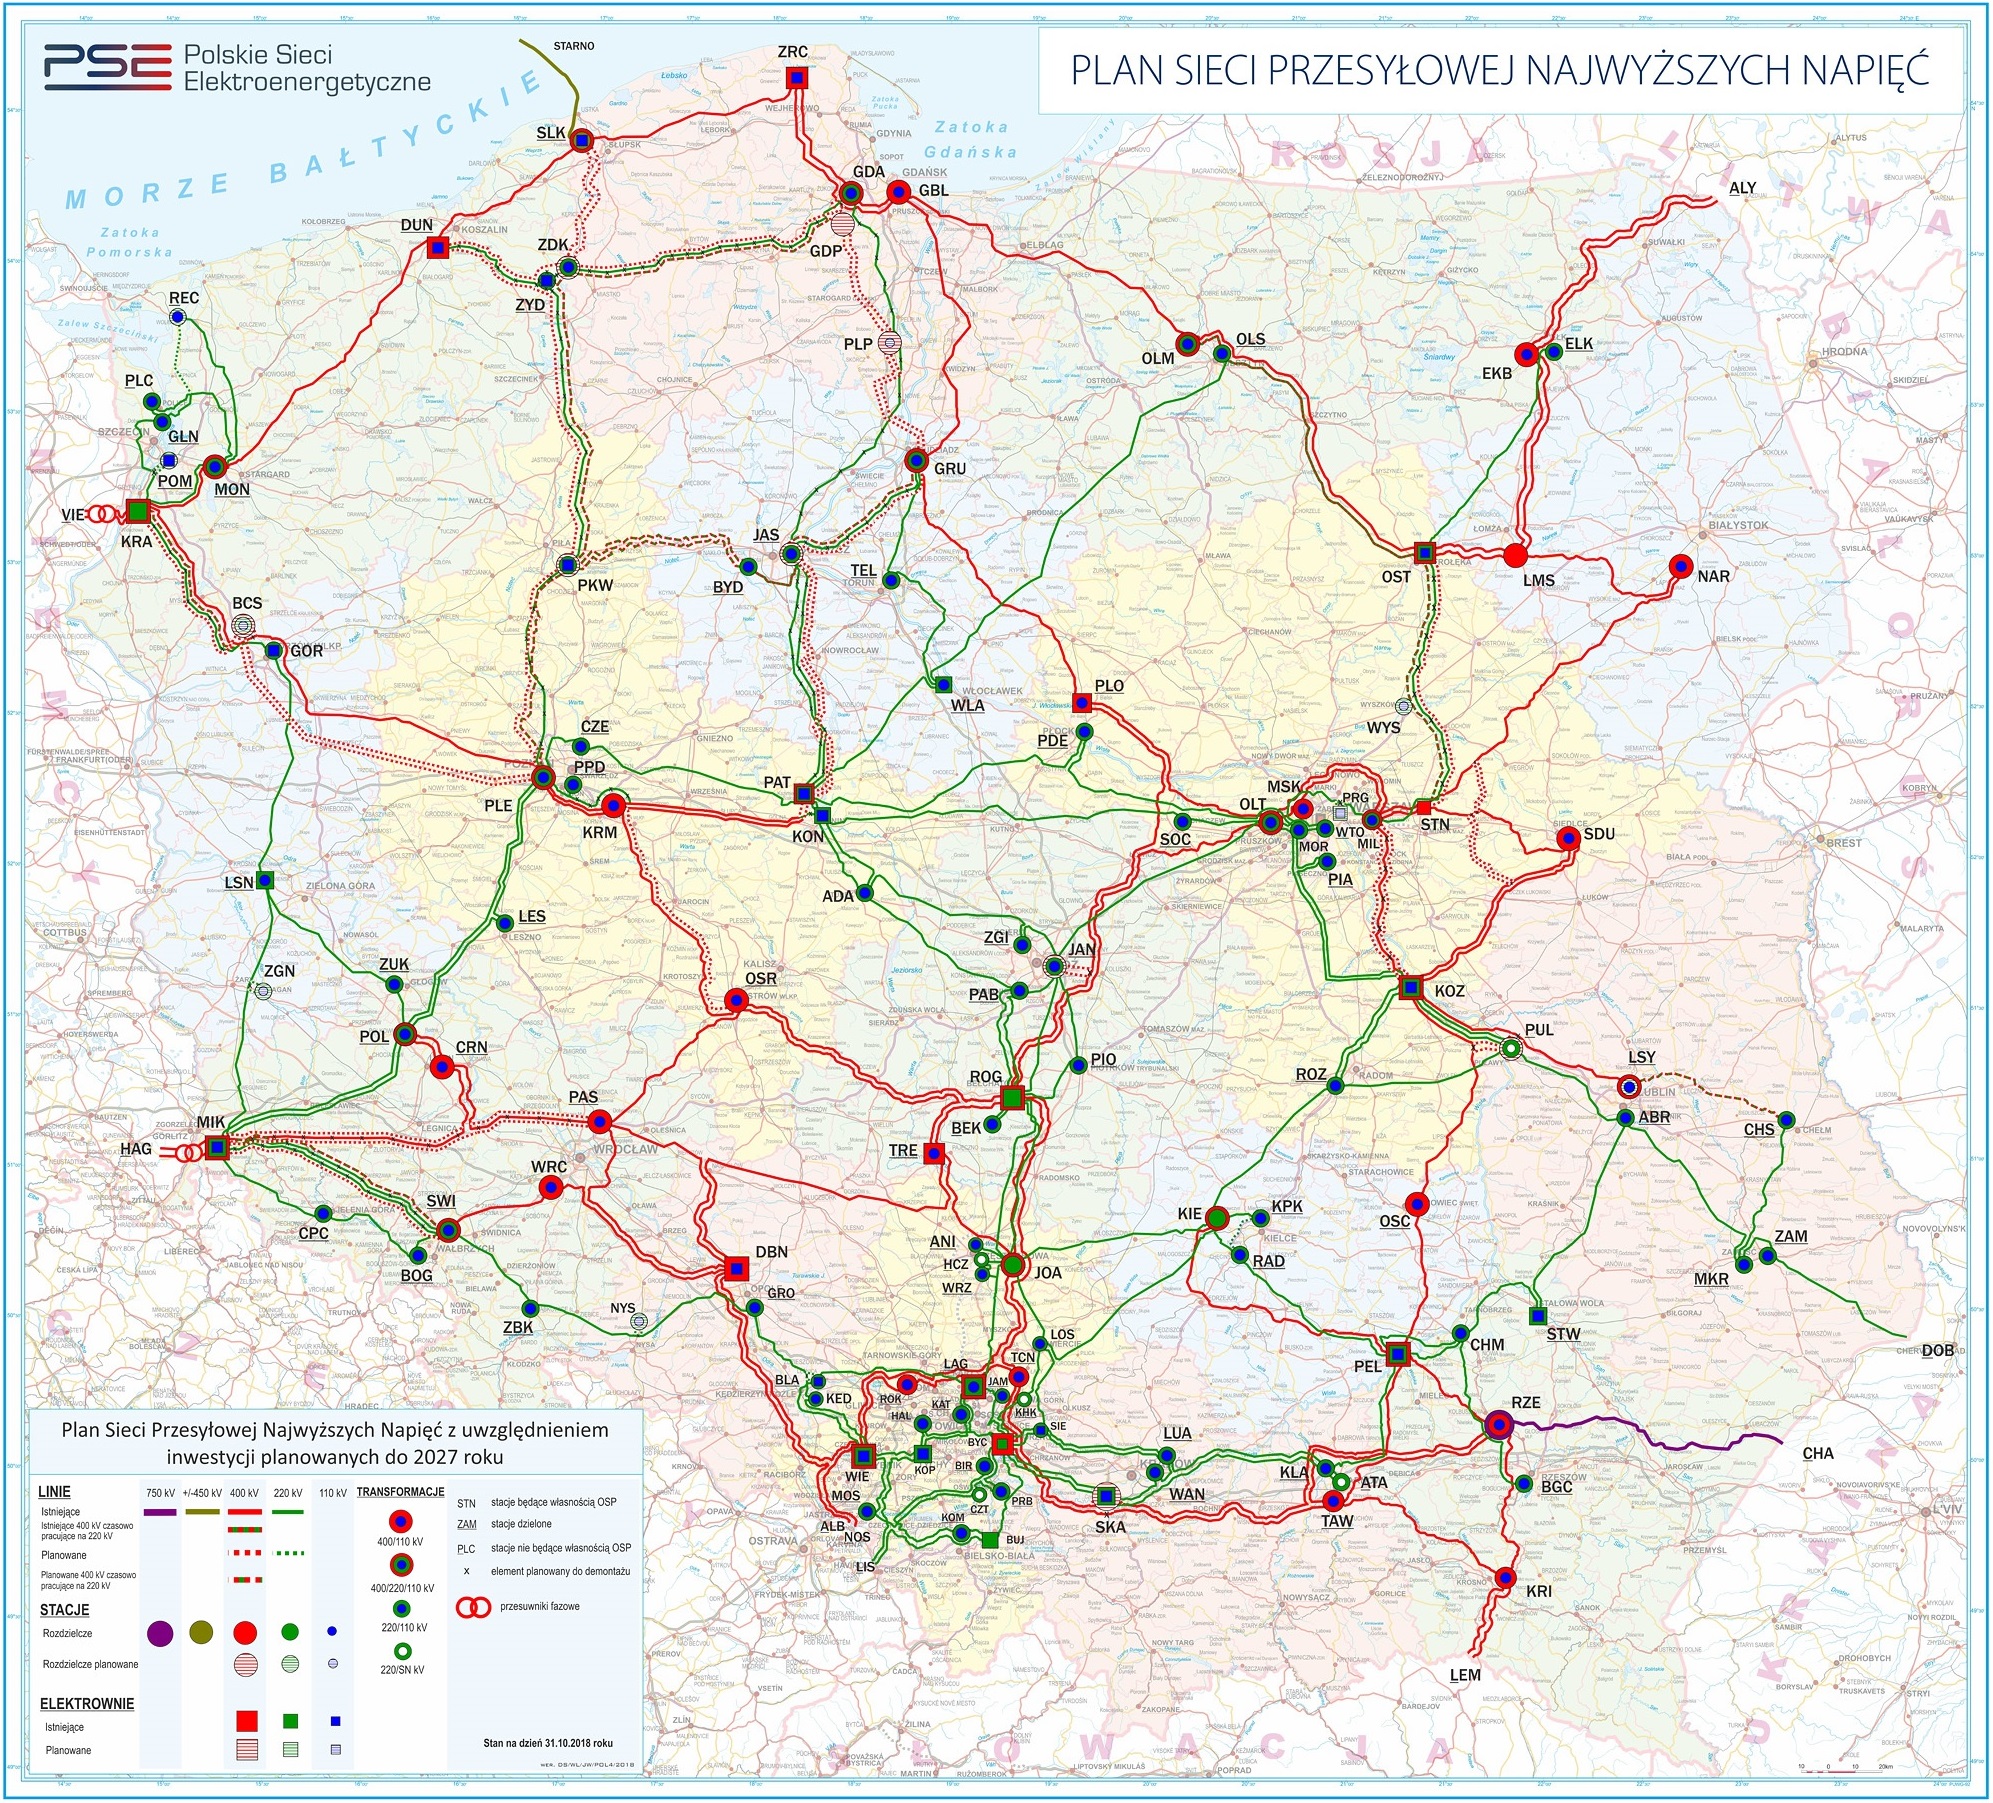
Polish TSO – PSE performs the duties of the transmission system operator using its own transmission grid of the highest voltage, which consists of (2018):
- 258 lines with a total length of 14 195 km, including:
– 1 line of 750kV voltage with a length of 114 km,
– 93 lines of 400kV voltage – 6 326 km,
– 164 lines of 220kV voltage – 7 755 km, - 106 extra-high voltage (EHV) substations
- under-sea 450kV DC connection between Poland and Sweden, with a total length of 254 km (127 km belongs to PSE).
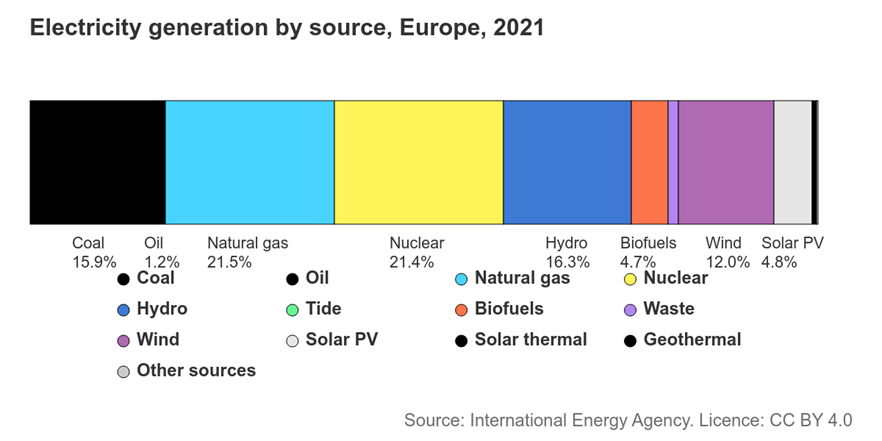
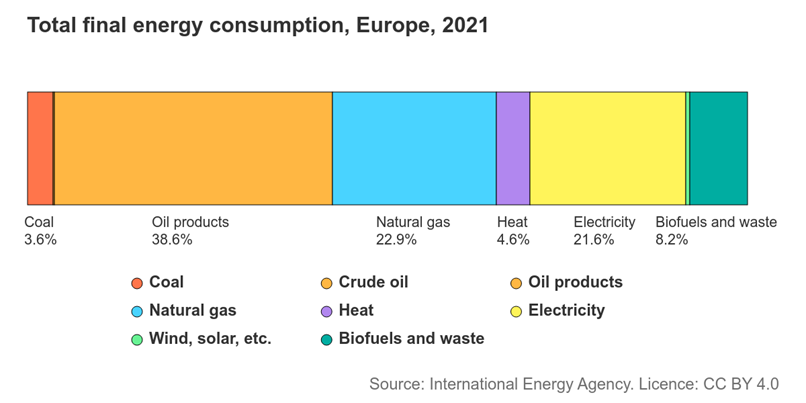
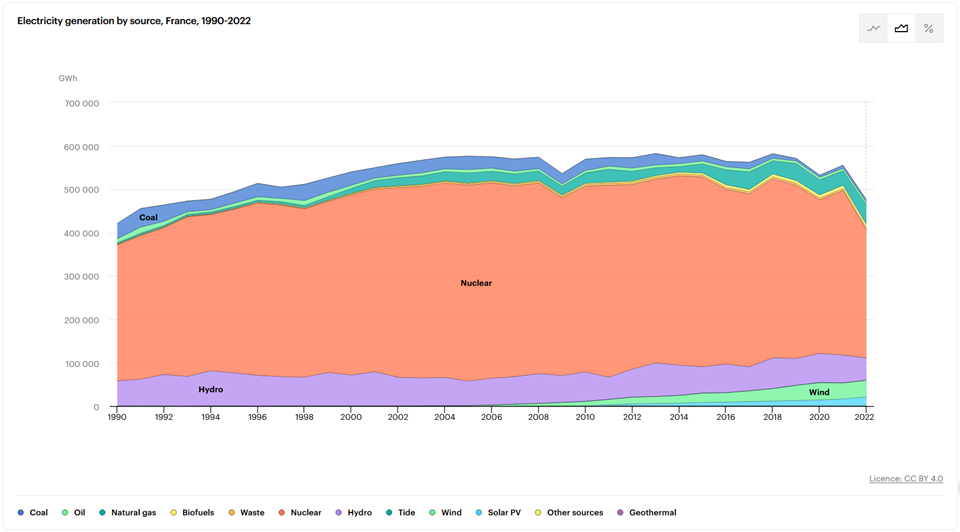
Energy mix of electricity generation and overall mix
So far, we have discussed the energy mixes of electricity generation, for example Europe:
4158 TWh/year or 14969 PJ/year
How does this mix differ from the overall energy mix?
58909 PJ/year
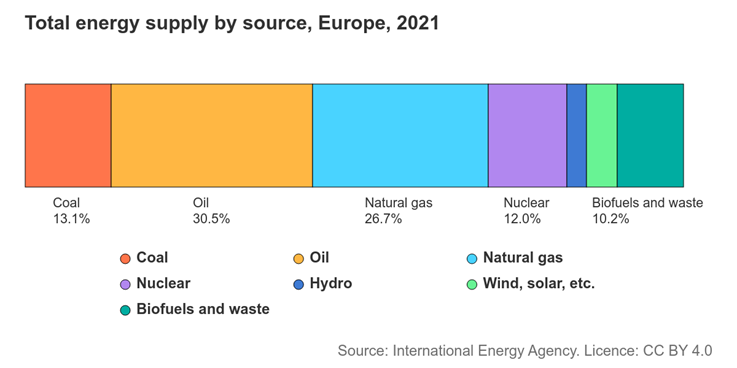
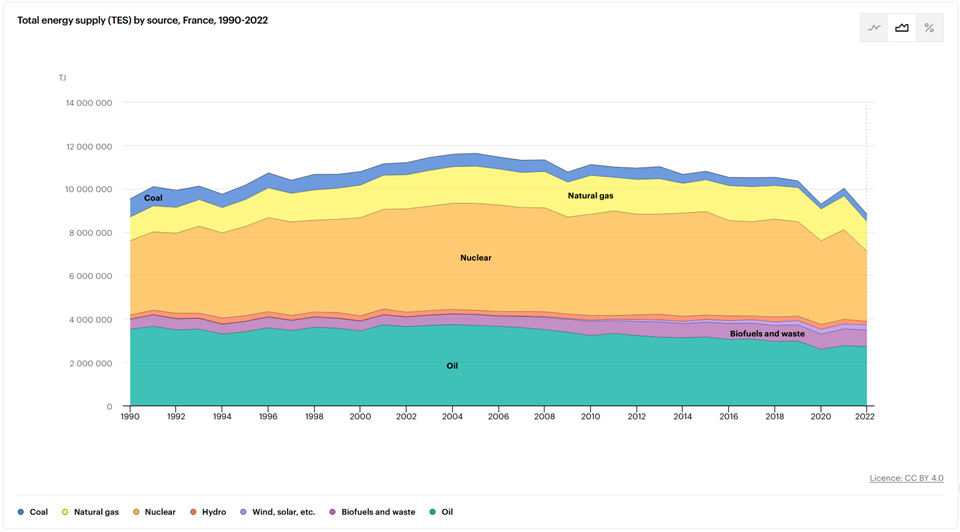
And from total energy supply?
81141 PJ/year
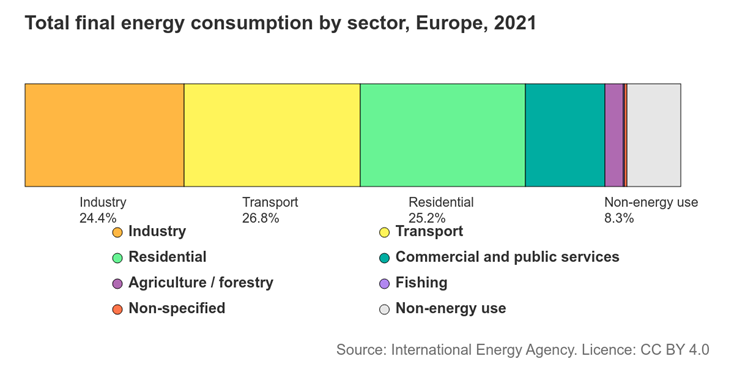
And who consumes this energy?
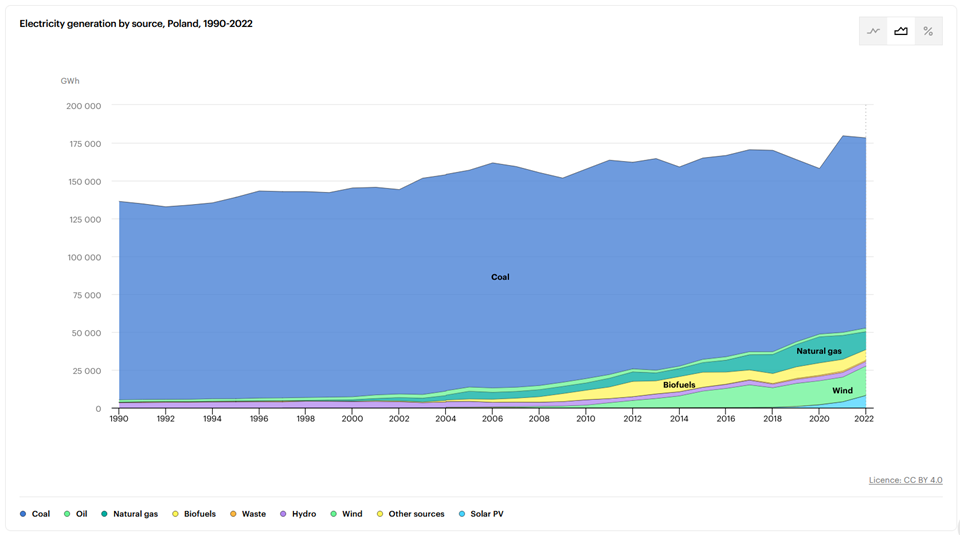
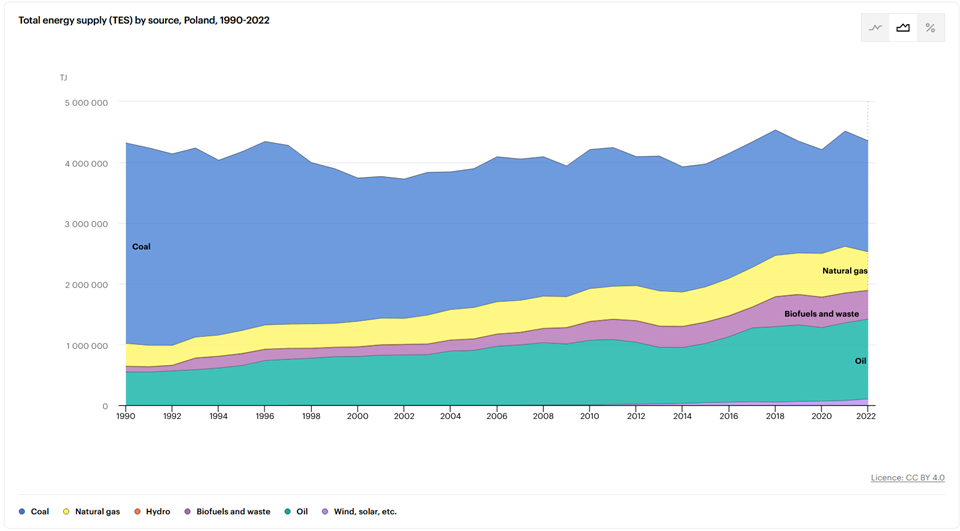
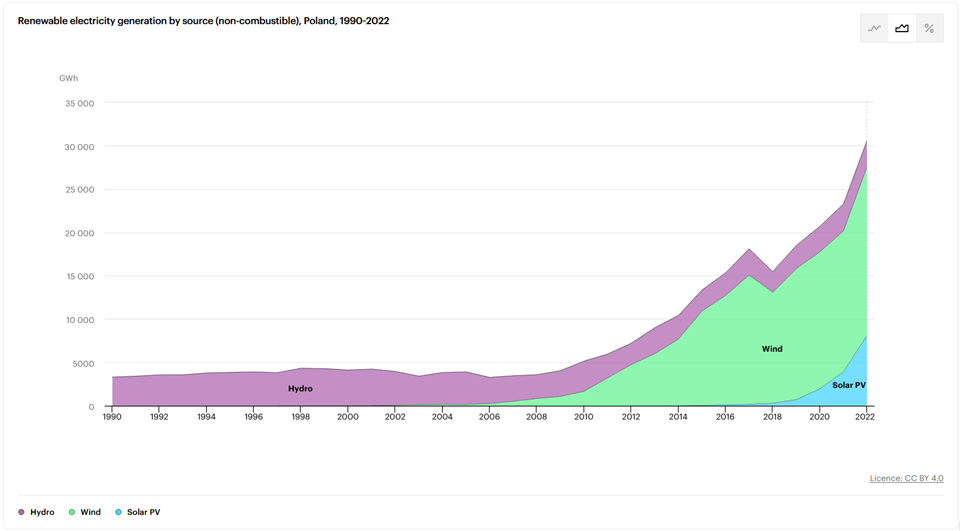
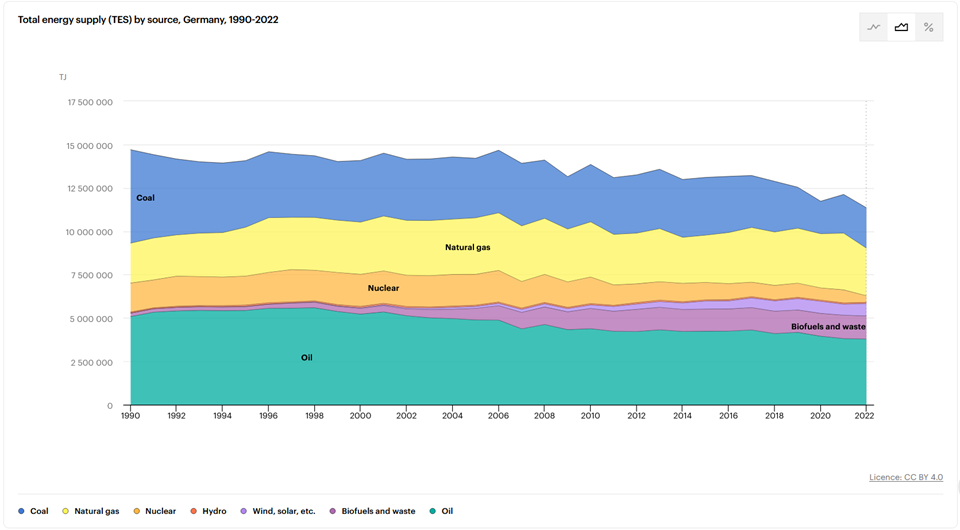
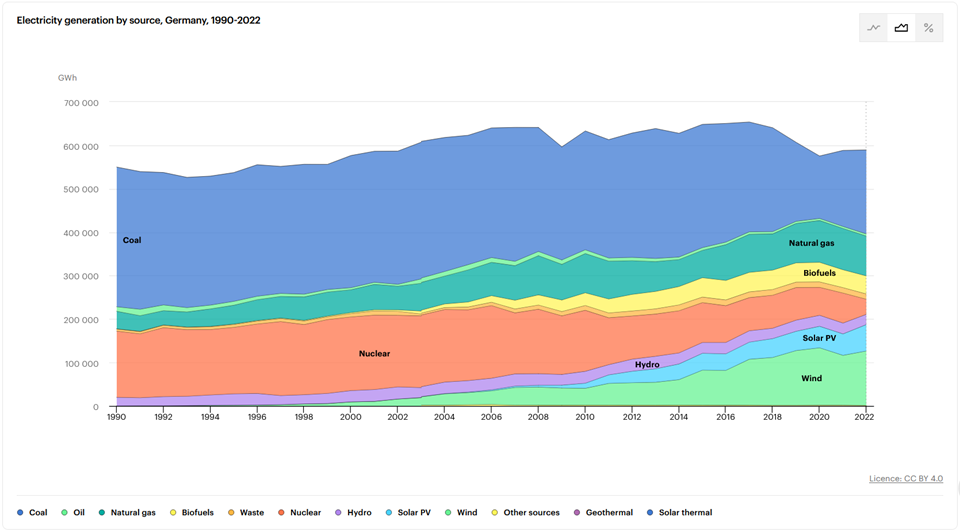
Some additional charts to study for yourself – how the energy mixes are changing
POLAND
GERMANY
FRANCE
Questions
1. What is the power system?(present different approaches)
2. What are the basic elements of power system? (give description)
3. What is the difference between electric power system and other economy systems?
4. What are typical voltage levels for transmission and distribution?
5. What are the levels of electric power system? (give description)
6. What are the most important parameters of electric power system operation?
7. What is ENTSOE?
8. Describe difference between: installed power of system, maximum capacity and available capacity.
9. Which voltage level network has the largest total length?