
20 Task 5. Synchronous generator steady state diagram
Aim of the task
The aim of the task is to learn about the way of calculation and representation of the synchronous generator steady state. To describe of the synchronous generator state the phasor/vector diagram will be used.
Introduction
The synchronous generator is a main electricity source in power system. On other hand synchronous generator is a dynamic devices whose analysis is usually stared for initial condition equals to steady state. Its corresponds to subtransient , transient and steady reactances of synchronous generator. The initial operation state of synchronous generator can be graphically described by means phasor/vector diagram.
Phasor/vector diagram
a) Two axis generator model
Model with two equivalent circuits in d and q generator axes is typical representation of the synchronous generator. Figure 5.1 shows the phasor/vector diagram resulting of synchronous generator. The steady state of generator is determined by the load flow solution. However, load flow equations are formulated in network complex coordinates (a – real axis, b – imaginary axis) while the current, voltage and emfs of generator are expreassed in the generator’s orthogonal coordinates (d – axis, q – axis). The q – axis is shifted with respect to the network a – real axis by the rotor angle d.
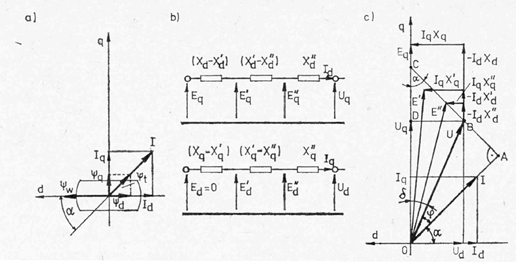
Fig.5.1. Phasor/vector diagram of synchronous generator : a) rotor diagram, b) circuit diagram, c) a phasor diagram in a steady state [1,2]
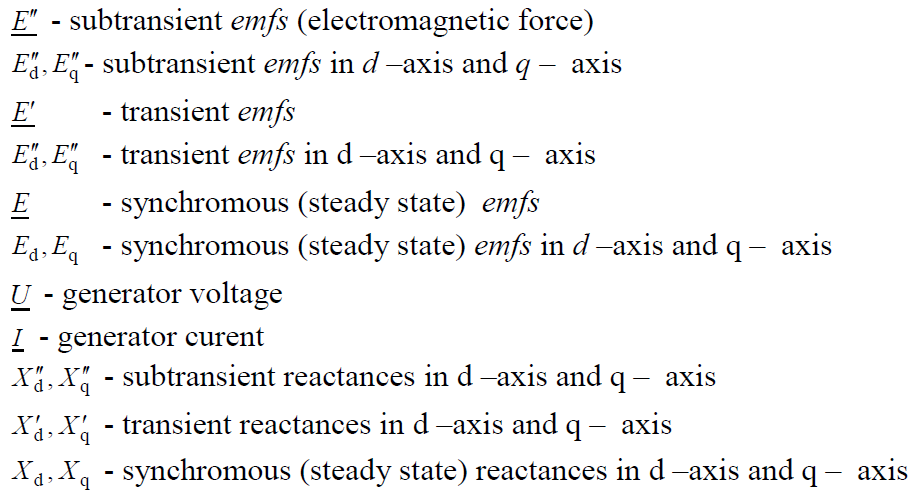
b) Used nomenclature
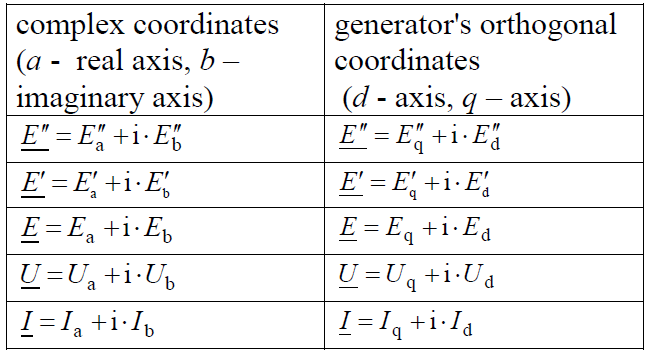
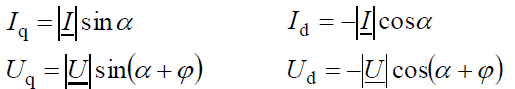
Complex electromagnetic forces, voltages and currents can be described as follows:
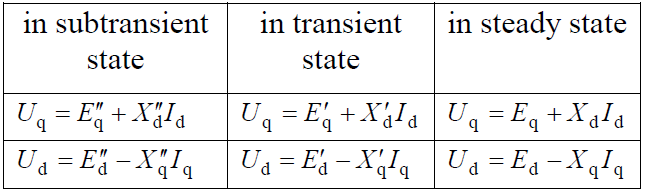
In case of r = 0 (generator armature resistance), then
Generator real and reactive power can be calculated using the following formulae
![]()
![]()
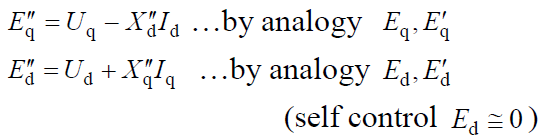
c) Determination of q-axis and emfs
From diagram
![]()
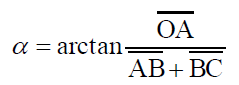
where length of segments:
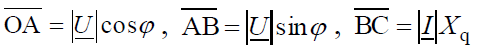
hence
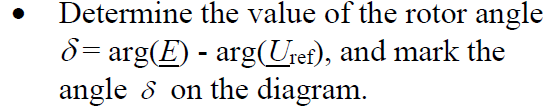
To find the steady –state of rotor angle ![]() it may use the following complex relation for the
it may use the following complex relation for the
factious emf ![]()
The angle of ![]() i s the angle of the generator rotor,
i s the angle of the generator rotor, ![]() .
.
Exercise
Content and input data:
Analysis refers to the test system presented in the task number 3 case b).
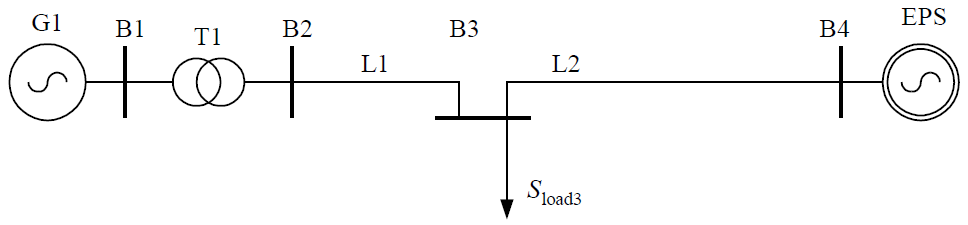
Fig.1. Schematic diagram of the test system.
To do:
Find (calculate) and plot a phasor diagram of a a synchronous generator in a steady state.
Diagram should contain the following elements (in accordance with the attached example):
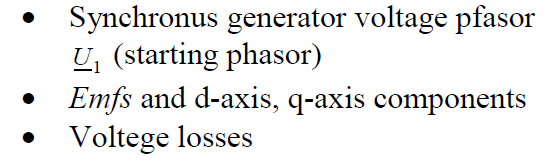
Diagram should also contain:
![]()
Moreover:
Additional notes:
1. Calculation should be carried out in per units
2. The plot should contain the diagram scale
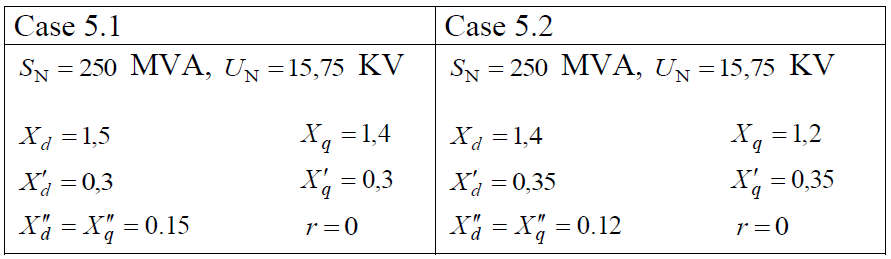
Synchronous generator parameters
Reactances are in per unit where base values are: Ub= 220 kV, Sb=100MVA
References
[1] Machowski J., Bialek J, Bumby J., Power system dynamics: stability and control. New York, USA: John Wiley & Sons; 2020.
[2] Machowski J., Bernas S., Stany nieustalone i stabilność systemu elektroenergetycznego,, WNT, 1988.