
21 Task 6. Capability chart of the generation unit
Aim of the task
The aim of the task is to learn about limitations related to admissible operating states of a generating source based on a synchronous generator. The area of admissible operating states will be determined by means capability chart.
Introduction
Real and reactive power produced by the generator depends on [1]:
- the electromagnetic force (emf)
 which is proportional to the generator field current
  ,
, - voltage U on the terminals of the step-up transformer,
- power angle
 (where
  – the angle between the voltage U and the generator emf
  ).
).
The voltage of a generator operating in a power system cannot change much and must be held within typically 10% percent of the network rated voltage.
Limits in the generator real and reactive power control are the result of the following constructional and operational constraints:
- Stator (armature) current I must not cause overheating of the armature winding. Hence it must be smaller than a certain maximum value
 , i.e.
  .
. - Rotor (field) current
 must not cause overheating of the field winding. Hence it must be smaller than a certain maximum value
  , i.e.
  or
or  .
. - The power angle must not be higher than a maximum value due to stable generator operation
 .
. - The temperature in the end region of the stator magnetic circuit must not exceed a maximum value
- The generator real power must be within the limits set by the turbine power, i.e.
 .
.
Capability chart
Capability chart of the synchronous generator can be determined analysing the following conditions:
a) Condition (1) – stator (armature) current
On the P-Q plane, that condition (i) corresponds to circle with the radius ![]() and the centre at the origin. Assuming a given voltage U and loading
and the centre at the origin. Assuming a given voltage U and loading  one gets
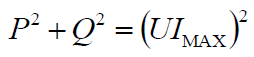
which corresponds to a circle with a radius ![]() .
.
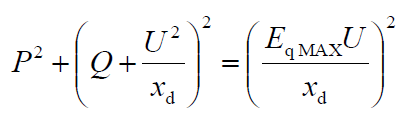
b) Condition (2) – rotor (field) current
In the P-Q plane, it corresponds to a circle with with a radius ![]() and a centre displaced from the origin along the reactive power axis Q by the value
and a centre displaced from the origin along the reactive power axis Q by the value ![]() .
.
c) Condition (3) – the power angle
On the P-Q plane, condition (iii) concerning the maximum value of the power angle, corresponds to a straight line. The position and tangent of the line can be derived the following way:
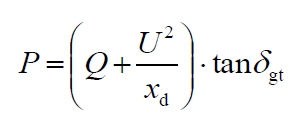
Substituting ![]() leads to
leads to ![]() where
where ![]() and
and 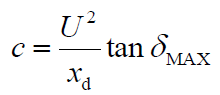
Above equation describes a straight line intersecting the reactive power axis at the angle  and at the point:
 ![]() or
or 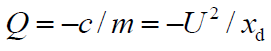 .
.
d) Condition (4) – the temperature
There is no simple mathematical formulation describing the constraint corresponding the end region heating limit. The relevant curve has to be determined experimentally by the manufacturer.
e) Condition (5) – turbine power
For steam turbines, the upper constraint ![]() is due to the maximum (rated) output of the turbine while the lower constraint
is due to the maximum (rated) output of the turbine while the lower constraint ![]() is due to stable operation of burners at a low turbine output. On the P-Q plane the upper and lower limits correspond to straight vertical lines
is due to stable operation of burners at a low turbine output. On the P-Q plane the upper and lower limits correspond to straight vertical lines ![]() and
and ![]() .
.
Fig. 6.1 shows the synchronous generator capability chart determined for given voltage.
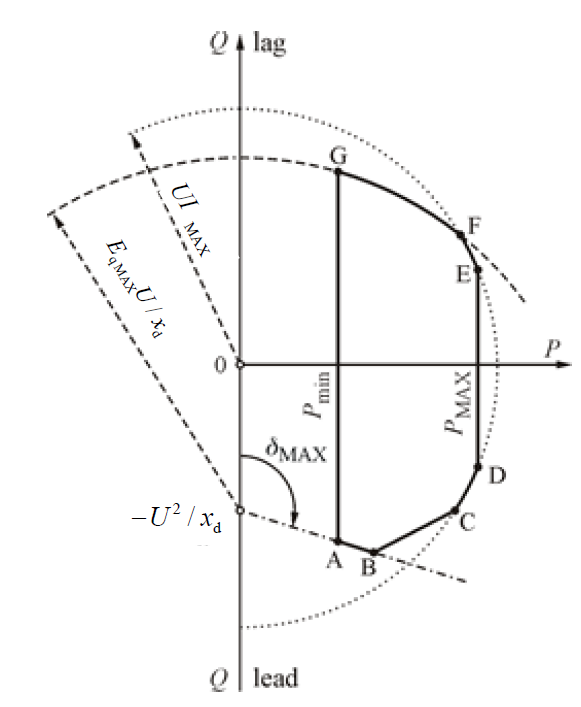
Fig.6.1. Synchronous generator capability chart assuming a given voltage, where segment A-B corresponds to the power angle condition, segment B-C corresponds to the temperature condition, segments C-D and E-F corresponds to stator (armature) current condition, segment D-E corresponds to upper turbine power condition, segment G-A corresponds to lower turbine power condition [1]
Exercise
Content and input data:
Analysis refers to the synchronous generator described in Task 5.
To do:
Calculate and plot a capability chart of a synchronous generator.
In the chart, mark the point corresponding to load of the generator. Verify if the operation point of the generator (P, Q) is located in the admissible area.
Additional assumptions:
- Calculation should be carried out in per units (base values correspond to rated values of the generator Ub= UN =15,75 kV, Sb= SN =250MVA)
- maximum value of the stator (armature) current is equal to current rated value IMAX=In
- turbine power limits: PMAX=1,05 Pn, Pmin=0,55 Pn or 0,45 Pn (where Pn – generator rated real power)
- generator-rated power factor cosjn = 0,85
- maximum value of excitation EfMAX = EqMAX = 3,5 or 3,6 or 3,7 or 3,8 or pu (for base values corresponding to rated values of the generator)
- power angle limit:
 = 120 or 110 or 100 deg
 - Condition corresponding to temperature in the end region of the stator magnetic circuit is ignored in analyze.
Hint:
In Task 5 reactances of synchronous generator were expressed in per unit but the base values were: Ub= 220 kV, Sb=100MVA (network base values). For capability chart calculation the base values related to rated values of generator Un and Sn should be taken into account.
Recalculation of the generator reactance:
Zb1 – base impedance for Ub =220 kV and Sb=100 MVA
Xd1 – generator reactance Xd from task 5
Zb2 – base impedance for Ub =15,750 kV and Sb =250 MVA
![]() – transformer ratio ( 245/15,75 or = 250/15,75 )
– transformer ratio ( 245/15,75 or = 250/15,75 )
References
[1] Machowski J., Bialek J, Bumby J., Power system dynamics: stability and control. New York, USA: John Wiley & Sons; 2020.